More Related Content
Similar to Trilogy test cma
Similar to Trilogy test cma (20)
Trilogy test cma
- 1. flexmls Web http://armls.flexmls.com/cgi-bin/mainmenu.cgi
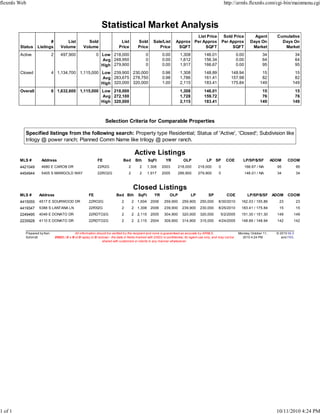
Statistical Market Analysis
List Price Sold Price Agent Cumulative
# List Sold List Sold Sale/List Approx Per Approx Per Approx Days On Days On
Status Listings Volume Volume Price Price Price SQFT SQFT SQFT Market Market
Active 2 497,900 0 Low 218,000 0 0.00 1,308 146.01 0.00 34 34
Avg 248,950 0 0.00 1,612 156.34 0.00 64 64
High 279,900 0 0.00 1,917 166.67 0.00 95 95
Closed 4 1,134,700 1,115,000 Low 239,900 230,000 0.96 1,308 148.89 148.94 15 15
Avg 283,675 278,750 0.98 1,786 161.41 157.98 82 82
High 320,000 320,000 1.00 2,115 183.41 175.84 149 149
Overall 6 1,632,600 1,115,000 Low 218,000 1,308 146.01 15 15
Avg 272,100 1,728 159.72 76 76
High 320,000 2,115 183.41 149 149
Selection Criteria for Comparable Properties
Specified listings from the following search: Property type Residential; Status of 'Active', 'Closed'; Subdivision like
trilogy @ power ranch; Planned Comm Name like trilogy @ power ranch.
Active Listings
MLS # Address FE Bed Bth SqFt YR OLP LP SP COE LP/SP/$/SF ADOM CDOM
4421049 4680 E CAROB DR 22R2G 2 2 1,308 2003 218,000 218,000 0 166.67 / NA 95 95
4454944 5405 S MARIGOLD WAY 22RO2G 2 2 1,917 2005 289,900 279,900 0 146.01 / NA 34 34
Closed Listings
MLS # Address FE Bed Bth SqFt YR OLP LP SP COE LP/SP/$/SF ADOM CDOM
4415055 4517 E SOURWOOD DR 22RO2G 2 2 1,604 2006 259,900 259,900 250,000 8/30/2010 162.03 / 155.86 23 23
4419347 5388 S LANTANA LN 22RX2G 2 2 1,308 2006 239,900 239,900 230,000 8/25/2010 183.41 / 175.84 15 15
2249495 4049 E DONATO DR 22RDTO2G 2 2 2,115 2005 304,900 320,000 320,000 5/2/2005 151.30 / 151.30 149 149
2235928 4110 E DONATO DR 22RDTO2G 2 2 2,115 2004 309,900 314,900 315,000 4/24/2005 148.89 / 148.94 142 142
Prepared by Ken All information should b e verified b y the recipient and none is guaranteed as accurate b y ARMLS. Monday, October 11, © 2010 MLS
Schmidt DND2 ( D o N ot D isplay or D isclose) - the data in fields marked with DND2 is confidential, for agent use only, and may not b e 2010 4:24 PM and FBS.
shared with customers or clients in any manner whatsoever.
1 of 1 10/11/2010 4:24 PM